

- Silver price clashed with the 200-day EMA and retreated afterward.
- If XAG/USD dives below $21.50, a test of the YTD low at $21.18 is on the cards.
- Oscillators turned bearish, opening the door for Silver’s further downside.
Silver price battles at the 200-day Exponential Moving Average (EMA) at $21.93 though it failed to crack the latter and retraced towards Tuesday’s lows as the North American session progressed. Investors awaiting the latest FOMC minutes sought safety in the US Dollar (USD), a headwind for the white metal. At the time of typing, the XAG/USD is trading at $21.62, down 0.70% in the day.
From a daily chart perspective, XAG/USD remains neutral to downward biased, as the white metal stays beneath the important 200-day EMA. Wednesday’s price action remains negative, while the Relative Strength Index (RSI) and the Rate of Change (RoC) indicate that sellers are gathering momentum.
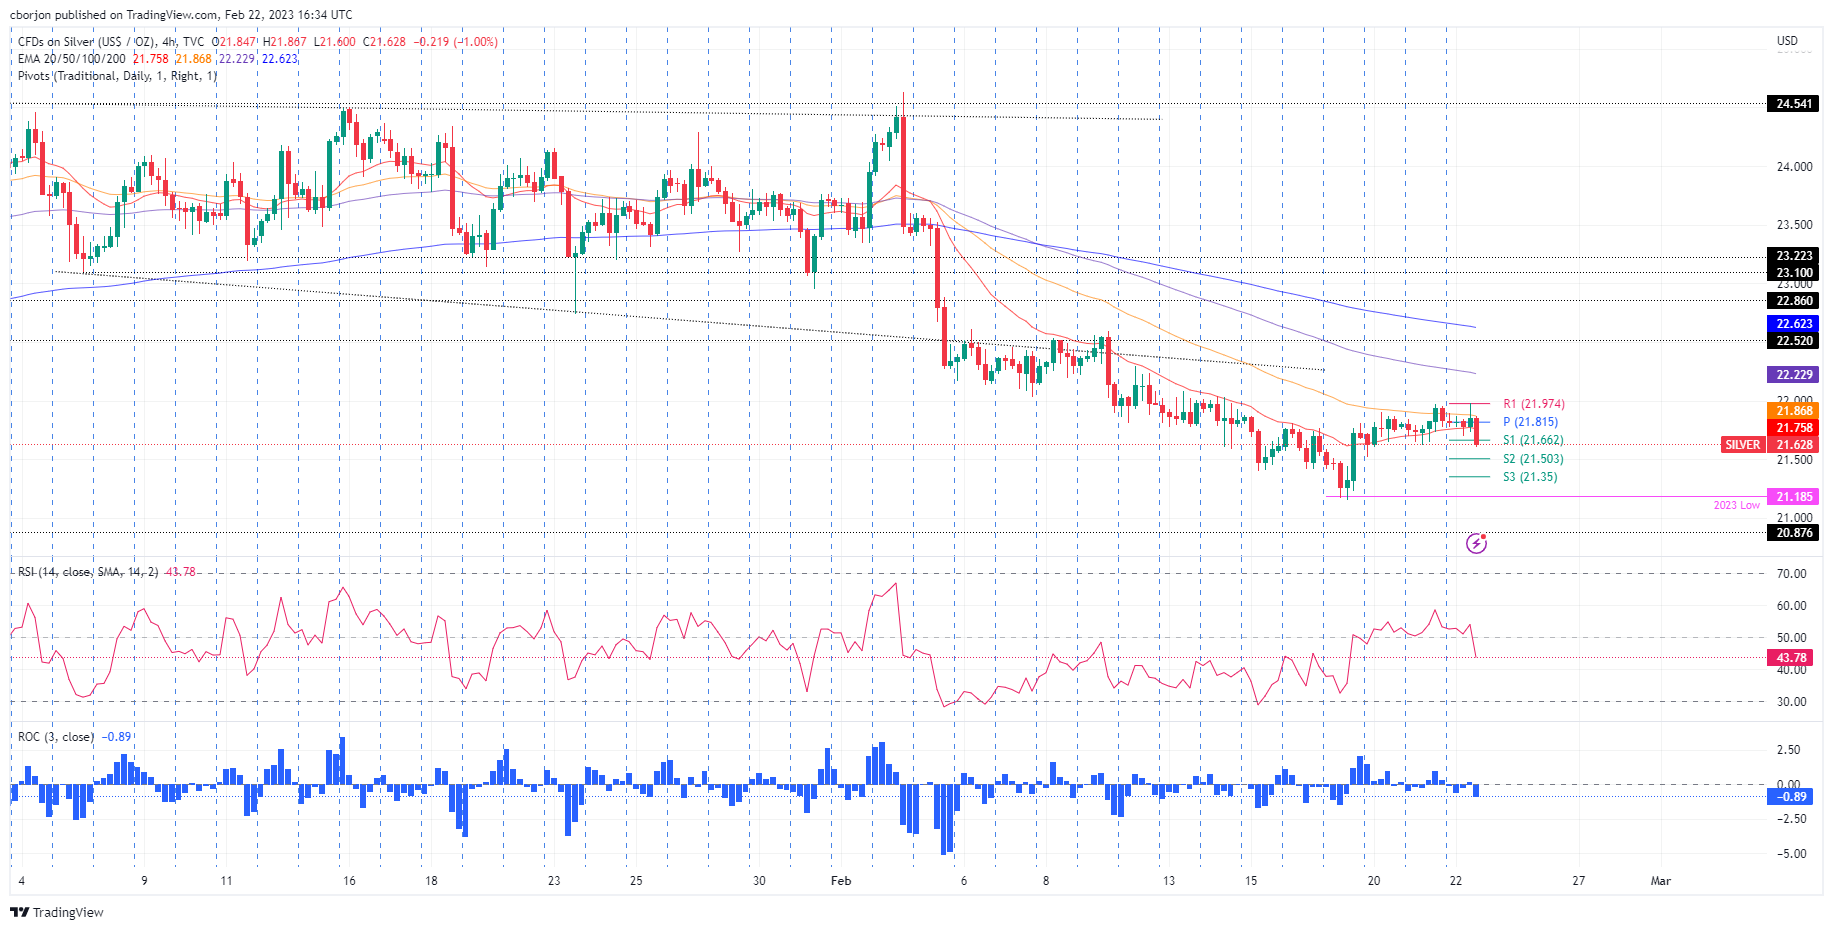
The XAG/USD 4-hour chart portrays the white metal as neutral to downward on an intraday bias. As of typing, Silver has breached the daily pivot point at $21.81, followed by the S1 pivot at $21.66. A bearish continuation is the most probable scenario due to several reasons. The Relative Strength Index (RSI) dived below the 50-mid line, a signal to go short, while the Rate of Change (RoC) is aiming aggressively downwards.
Therefore, the XAG/USD first support would be the S2 pivot point at $21.50. A breach of the latter will expose the S3 daily pivot at $21.35, ahead of the YTD low of $21.18. As an alternate scenario, XAG/USD reclaims the 200-day EMA could pave the way toward $22.00.
XAG/USD 4-hour chart
XAG/USD Key technical levels
Information on these pages contains forward-looking statements that involve risks and uncertainties. Markets and instruments profiled on this page are for informational purposes only and should not in any way come across as a recommendation to buy or sell in these assets. You should do your own thorough research before making any investment decisions. FXStreet does not in any way guarantee that this information is free from mistakes, errors, or material misstatements. It also does not guarantee that this information is of a timely nature. Investing in Open Markets involves a great deal of risk, including the loss of all or a portion of your investment, as well as emotional distress. All risks, losses and costs associated with investing, including total loss of principal, are your responsibility. The views and opinions expressed in this article are those of the authors and do not necessarily reflect the official policy or position of FXStreet nor its advertisers. The author will not be held responsible for information that is found at the end of links posted on this page.
If not otherwise explicitly mentioned in the body of the article, at the time of writing, the author has no position in any stock mentioned in this article and no business relationship with any company mentioned. The author has not received compensation for writing this article, other than from FXStreet.
FXStreet and the author do not provide personalized recommendations. The author makes no representations as to the accuracy, completeness, or suitability of this information. FXStreet and the author will not be liable for any errors, omissions or any losses, injuries or damages arising from this information and its display or use. Errors and omissions excepted.
The author and FXStreet are not registered investment advisors and nothing in this article is intended to be investment advice.
0 Comments :
Post a Comment