

- Silver regains positive traction on Thursday and reverses a part of the overnight slide.
- The formation of a rectangle on the daily chart marks a bearish consolidation phase.
- A sustained break below the 50% Fibo. level will set the stage for a further downfall.
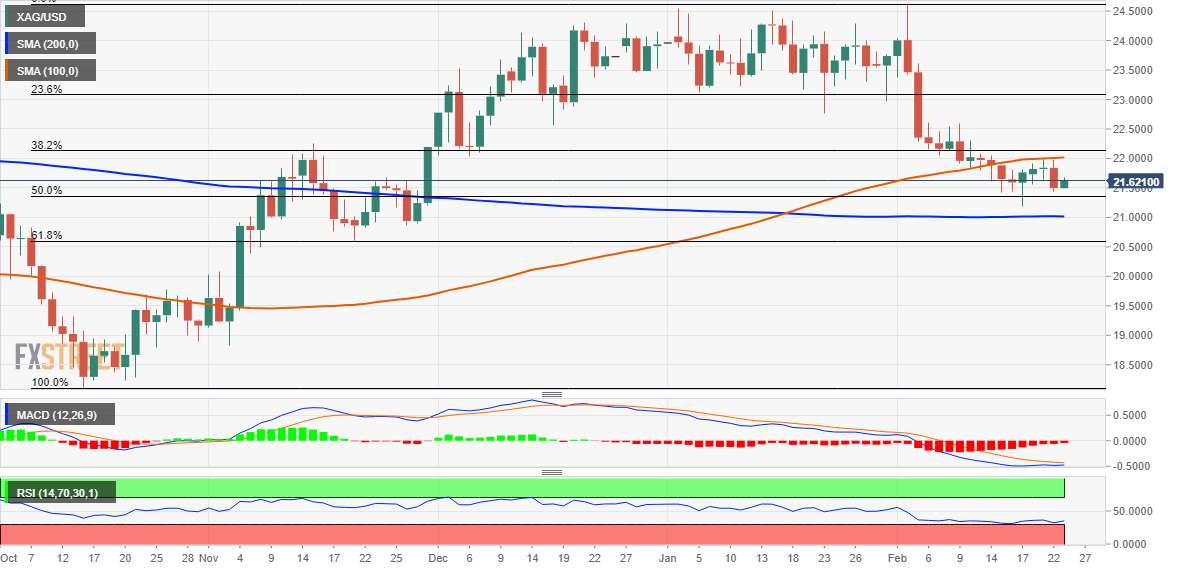
Silver attracts some buyers on Thursday and reverses a part of the previous day’s rejection slide from a technically significant 100-day Simple Moving Average (SMA) around the $22.00 mark. The white metal sticks to its gains through the early European session and currently trades around the $21.65-$21.70 area, up around 0.80% for the day.
Looking at the broader picture, the XAG/USD has been oscillating in a familiar range over the past week or so, forming a rectangle on the daily chart. Against the backdrop of the recent pullback from the $24.65 area, or the highest level since April 2022, the rectangle could now be categorized as a bearish consolidation phase. Moreover, oscillators on the daily chart are holding deep in the negative zone and are still far from being in the oversold territory.
The aforementioned technical setup suggests that the path of least resistance for the XAG/USD is to the downside. That said, bearish traders are more likely to wait for a convincing break below the 50% Fibonacci retracement level of the recent rally from October 2022 before placing aggressive bets. Some follow-through selling below the monthly low, around the $22.20-$22.15 area, will reaffirm the negative bias and pave the way for deeper losses.
The XAG/USD might then accelerate the fall towards testing the next relevant support near the $20.60 zone. The downward trajectory could get extended further towards the $20.00 psychological mark and drag the white metal to the $19.75-$19.70 region.
On the flip side, any further move up might continue to confront stiff resistance near the $22.00 mark, or the 100-day SMA. That said, some follow-through buying beyond the 38.2% Fibo. level of the recent rally from October 2022, around the $22.15 zone, could negate the bearish bias. The subsequent short-covering rally might then lift the XAG/USD towards the $22.55-$22.60 supply zone, en route to the 23.6% Fibo. level, around the $23.00 round figure.
Silver daily chart
Key levels to watch
Information on these pages contains forward-looking statements that involve risks and uncertainties. Markets and instruments profiled on this page are for informational purposes only and should not in any way come across as a recommendation to buy or sell in these assets. You should do your own thorough research before making any investment decisions. FXStreet does not in any way guarantee that this information is free from mistakes, errors, or material misstatements. It also does not guarantee that this information is of a timely nature. Investing in Open Markets involves a great deal of risk, including the loss of all or a portion of your investment, as well as emotional distress. All risks, losses and costs associated with investing, including total loss of principal, are your responsibility. The views and opinions expressed in this article are those of the authors and do not necessarily reflect the official policy or position of FXStreet nor its advertisers. The author will not be held responsible for information that is found at the end of links posted on this page.
If not otherwise explicitly mentioned in the body of the article, at the time of writing, the author has no position in any stock mentioned in this article and no business relationship with any company mentioned. The author has not received compensation for writing this article, other than from FXStreet.
FXStreet and the author do not provide personalized recommendations. The author makes no representations as to the accuracy, completeness, or suitability of this information. FXStreet and the author will not be liable for any errors, omissions or any losses, injuries or damages arising from this information and its display or use. Errors and omissions excepted.
The author and FXStreet are not registered investment advisors and nothing in this article is intended to be investment advice.
0 Comments :
Post a Comment